Population
Population figures provide information on population development and density and thus indirectly on the economic attractiveness of an area. Closely linked to this are the existence and extent of the transport and energy supply infrastructure, social facilities and medical care, and the number of residential buildings. The age distribution provides information on supply needs such as schools, daycare centers and facilities for the elderly and is of particular interest for further planning on sustainable mobility. Thus, the population figures serve as a basis for many further analyses.
Click here to go directly to the subtopics:
Population development
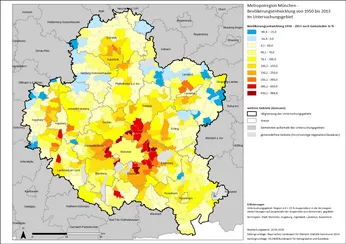
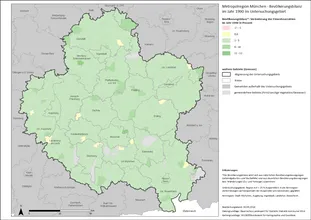
The Munich region is booming. Despite declining population figures throughout Germany, the Munich area is experiencing unabated population growth. Map 1 shows the development of the population from 1950 to 2013. It is striking that the population has increased in almost all of the communities studied. In particular, a high increase took place in the Munich environs - some municipalities are now home to almost 10 times as many people as they were in 1950. The municipalities concerned have thus undergone an enormous transformation within the last few decades.
However, the relative population growth provides little information on absolute growth figures. For example, in the case of the front-runner, the municipality of Kirchheim b. München, the population increased by 988%, namely from about 1,180 to approx. 12,800 inhabitants (increase: approx. 11,630 inhabitants). In the same period, the population of the city of Munich grew by almost 580,000 inhabitants (2013: approx. 1,408,000 inhabitants). However, since 830,000 inhabitants were already recorded here in 1950, this represents an increase of around 70%, which seems relatively moderate compared to most surrounding municipalities.
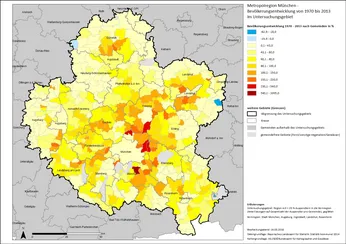
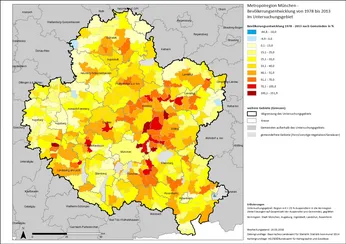
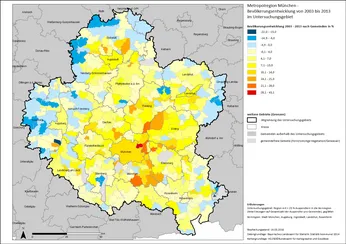
Municipalities with declining populations are predominantly located on the periphery of the study area. It is interesting to note that there has not been a continuous decline here, but that population numbers have also increased in the meantime, as can be seen in Map 2 (1970 - 2013) and Map 3 (1978 - 2013). The decline can be seen most clearly within the last decade (Map 4: 2003-2013).
Population movements
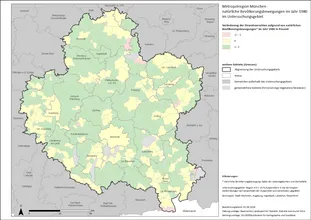
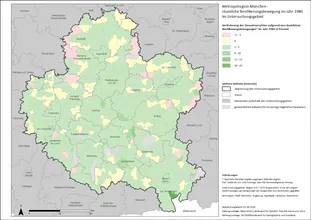
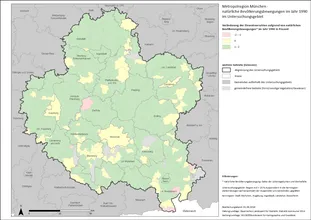
It is not only interesting to determine with the help of the overall balance whether the population of a certain region has decreased, remained the same or increased during a certain period. It is also informative to what extent this can be attributed to "natural population movements" (= balance of live births and deaths) and "spatial population movements" (= balance of inflows and outflows). The years 1960, 1970, 1980, 1990, 2000 and 2013 were analyzed for the study area.
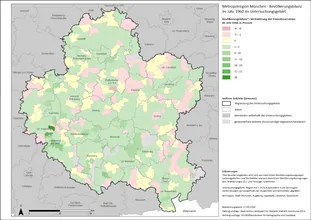
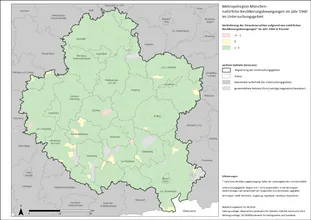
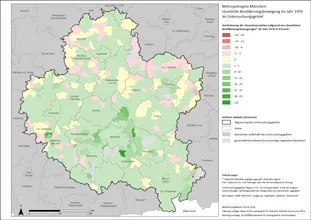
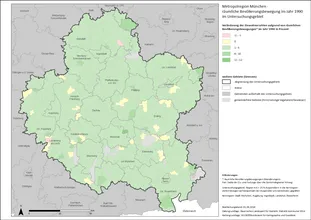
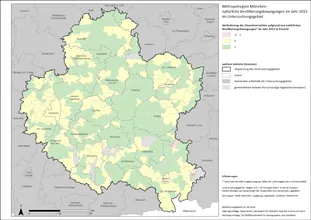
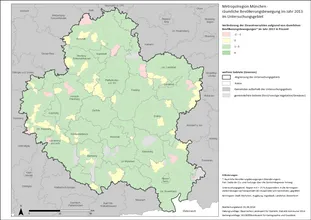
In 1960, in the overall balance (Map 1), the changes in the number of inhabitants showed a relatively wide range compared to other years (-8 to +39%). The population grew in most municipalities, but in significantly fewer municipalities than in the years thereafter. Municipalities with declining or stagnant populations tended to be located in the outlying areas between the core cities. Map 2 shows that this was due only to a small extent to natural population movement: here, the range of fluctuation was much narrower and almost all municipalities recorded a slight increase due to births. Accordingly, most of the dynamics occurred through inflows and outflows (this applies to all years, by the way). Map 3 shows the differences between urban and rural areas even more clearly. It can be assumed that in 1960 many people moved from rural to urban areas in the course of urbanization.
1970 was the year with the strongest dynamics and thus also the strongest differences between the municipalities. Although some of the maps look more homogeneous in terms of area, the values are further apart. The largest proportional population loss was in the municipality of Chiemsee with 19%, the largest increase was in the municipality of Taufkirchen. Here, the number of inhabitants more than doubled within one year with +113%. Overall, the neighboring Munich communities in particular experienced strong growth.
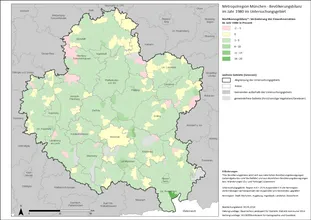
In 1980, the range of fluctuation decreases significantly, both for increases and decreases in the number of inhabitants. As in 1970, there were slightly more births than deaths or the same number in most municipalities. Most of the municipalities also experienced a slight increase due to immigration; the front-runner here was the municipality of Nußdorf a.Inn.
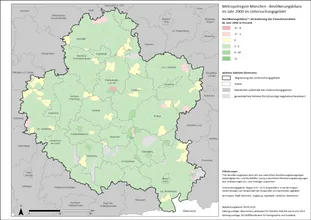
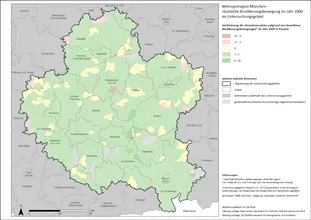
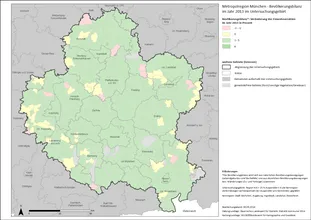
In 2013, there were again significantly more municipalities with stagnant natural population growth. These values were only between -2% and +1% overall, so there were no major differences between the individual municipalities. Most municipalities continued to experience slight population growth due to in-migration. The maximum growth value fell further to 6%.
Density
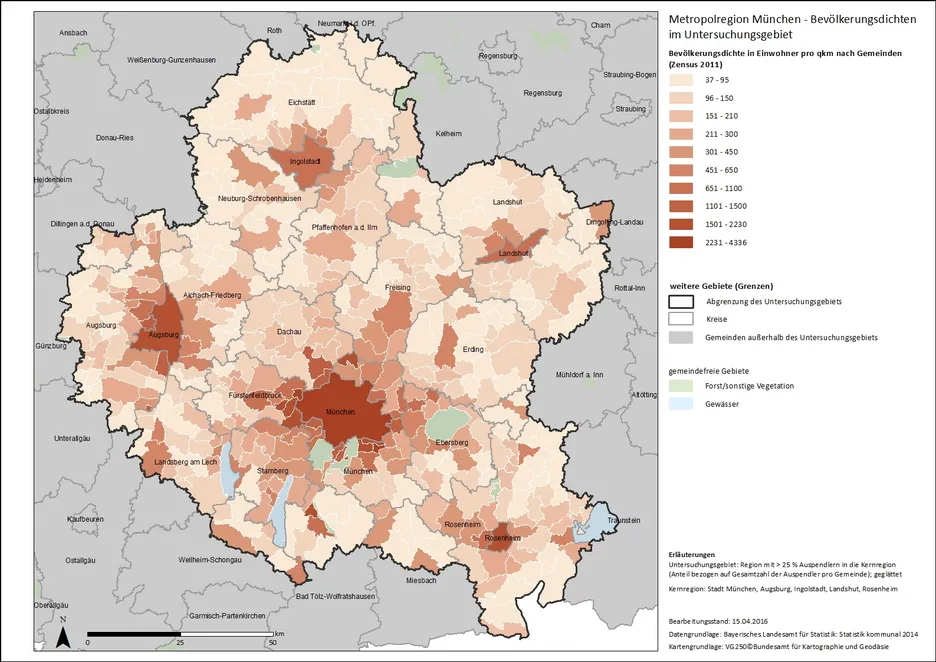
The population density reflects the number of people per square kilometer and thus shows how densely populated the area is. It is not surprising that the highest population densities are found in the core cities of Munich, Augsburg, Ingolstadt, Landshut and Rosenheim and their surrounding areas. Smaller cities such as Landsberg a. Lech, Aichach and Eichstätt can also be identified. In the case of Freising and Erding, the proximity to Franz-Joseph-Strauss Airport and the associated jobs and good transport links certainly also play a role.
Municipalities in the vicinity of the larger lakes also have higher settlement densities: on the one hand, they offer a high quality of living and, on the other hand, they are still within easy reach of Munich, which makes them desirable places to live.
Age distribution
The study of age distribution is limited to the youngest and oldest population groups. These are particularly interesting for further investigations, as their mobility behavior differs greatly from that of the group of mostly working middle-aged people.
Map 1 shows the proportion of the population under 18. Here, a difference can be seen between urban and rural areas, with rural regions tending to have higher shares. One important reason is certainly the lower rents or house prices in rural areas. Families with children generally need more living space and therefore often move specifically from the city to the countryside (see also household sizes). In addition, the lifestyle may play a role, which tends to be more traditional in the countryside and includes starting a family, while in large cities there are more lifestyles in which there is no desire to have children or this is put on the back burner.
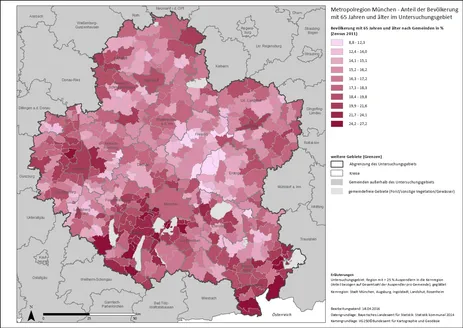
People aged 65 and older, on the other hand, tend to live more in cities or near-city communities (see Map 2). Here, the supply of stores, specialist doctors and care facilities is generally better, as is the local public transport network, which enables greater mobility, especially for those with limited physical mobility. Some rural communities also have high proportions of older people - in many cases, facilities for the elderly are located here, where they live permanently.
Foreign population
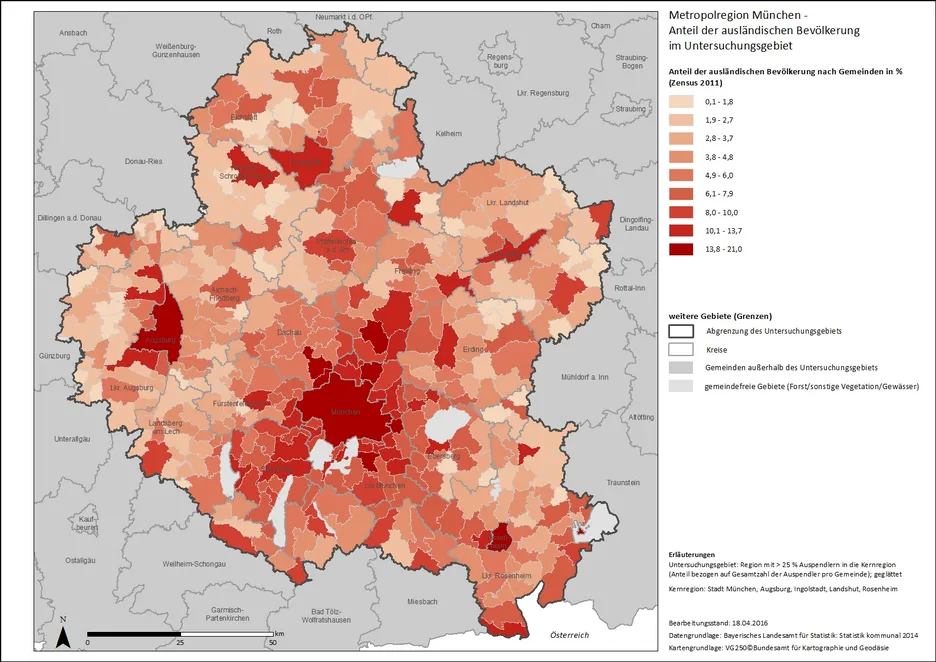
Clear patterns can be discerned in the proportion of foreigners in the population. In addition to Munich, the other larger cities such as Augsburg, Ingolstadt, Landshut, Rosenheim, Freising and Dachau stand out strongly from their surroundings due to their high proportions of foreigners, often together with communities in their immediate neighborhood. Smaller towns such as Wasserburg a. Inn or Mainburg also stand out. Important reasons for this are certainly that in cities there are usually more and more diverse jobs, leisure activities and supply options, the society is usually more heterogeneous and compatriots are more frequently encountered. In many cities, there is a diverse range of cultural associations and events for a wide variety of ethnic groups and native languages.
Furthermore, the concentration in the Munich environs is noticeable, which gradually decreases with increasing distance. This can be explained by the disproportionately high level of all the above-mentioned aspects in the state capital, in connection with the connection of the surrounding communities to Munich's public transportation network. Of course, the spatial accessibility of Munich plays a role under many sociodemographic aspects (see, for example, commuter relations).
